The Complete Guide to Gantt Charts in 2025: Everything You Need to Know
Project timelines can make or break your success. Whether you're managing a software development sprint, planning a marketing campaign, or coordinating a construction project, visual timeline management has become essential for modern project managers.
Enter the Gantt chart - a powerful visualization tool that transforms complex project schedules into clear, actionable timelines. But what exactly makes Gantt charts so effective, and how can you leverage them for maximum impact in 2025?
What is a Gantt Chart?
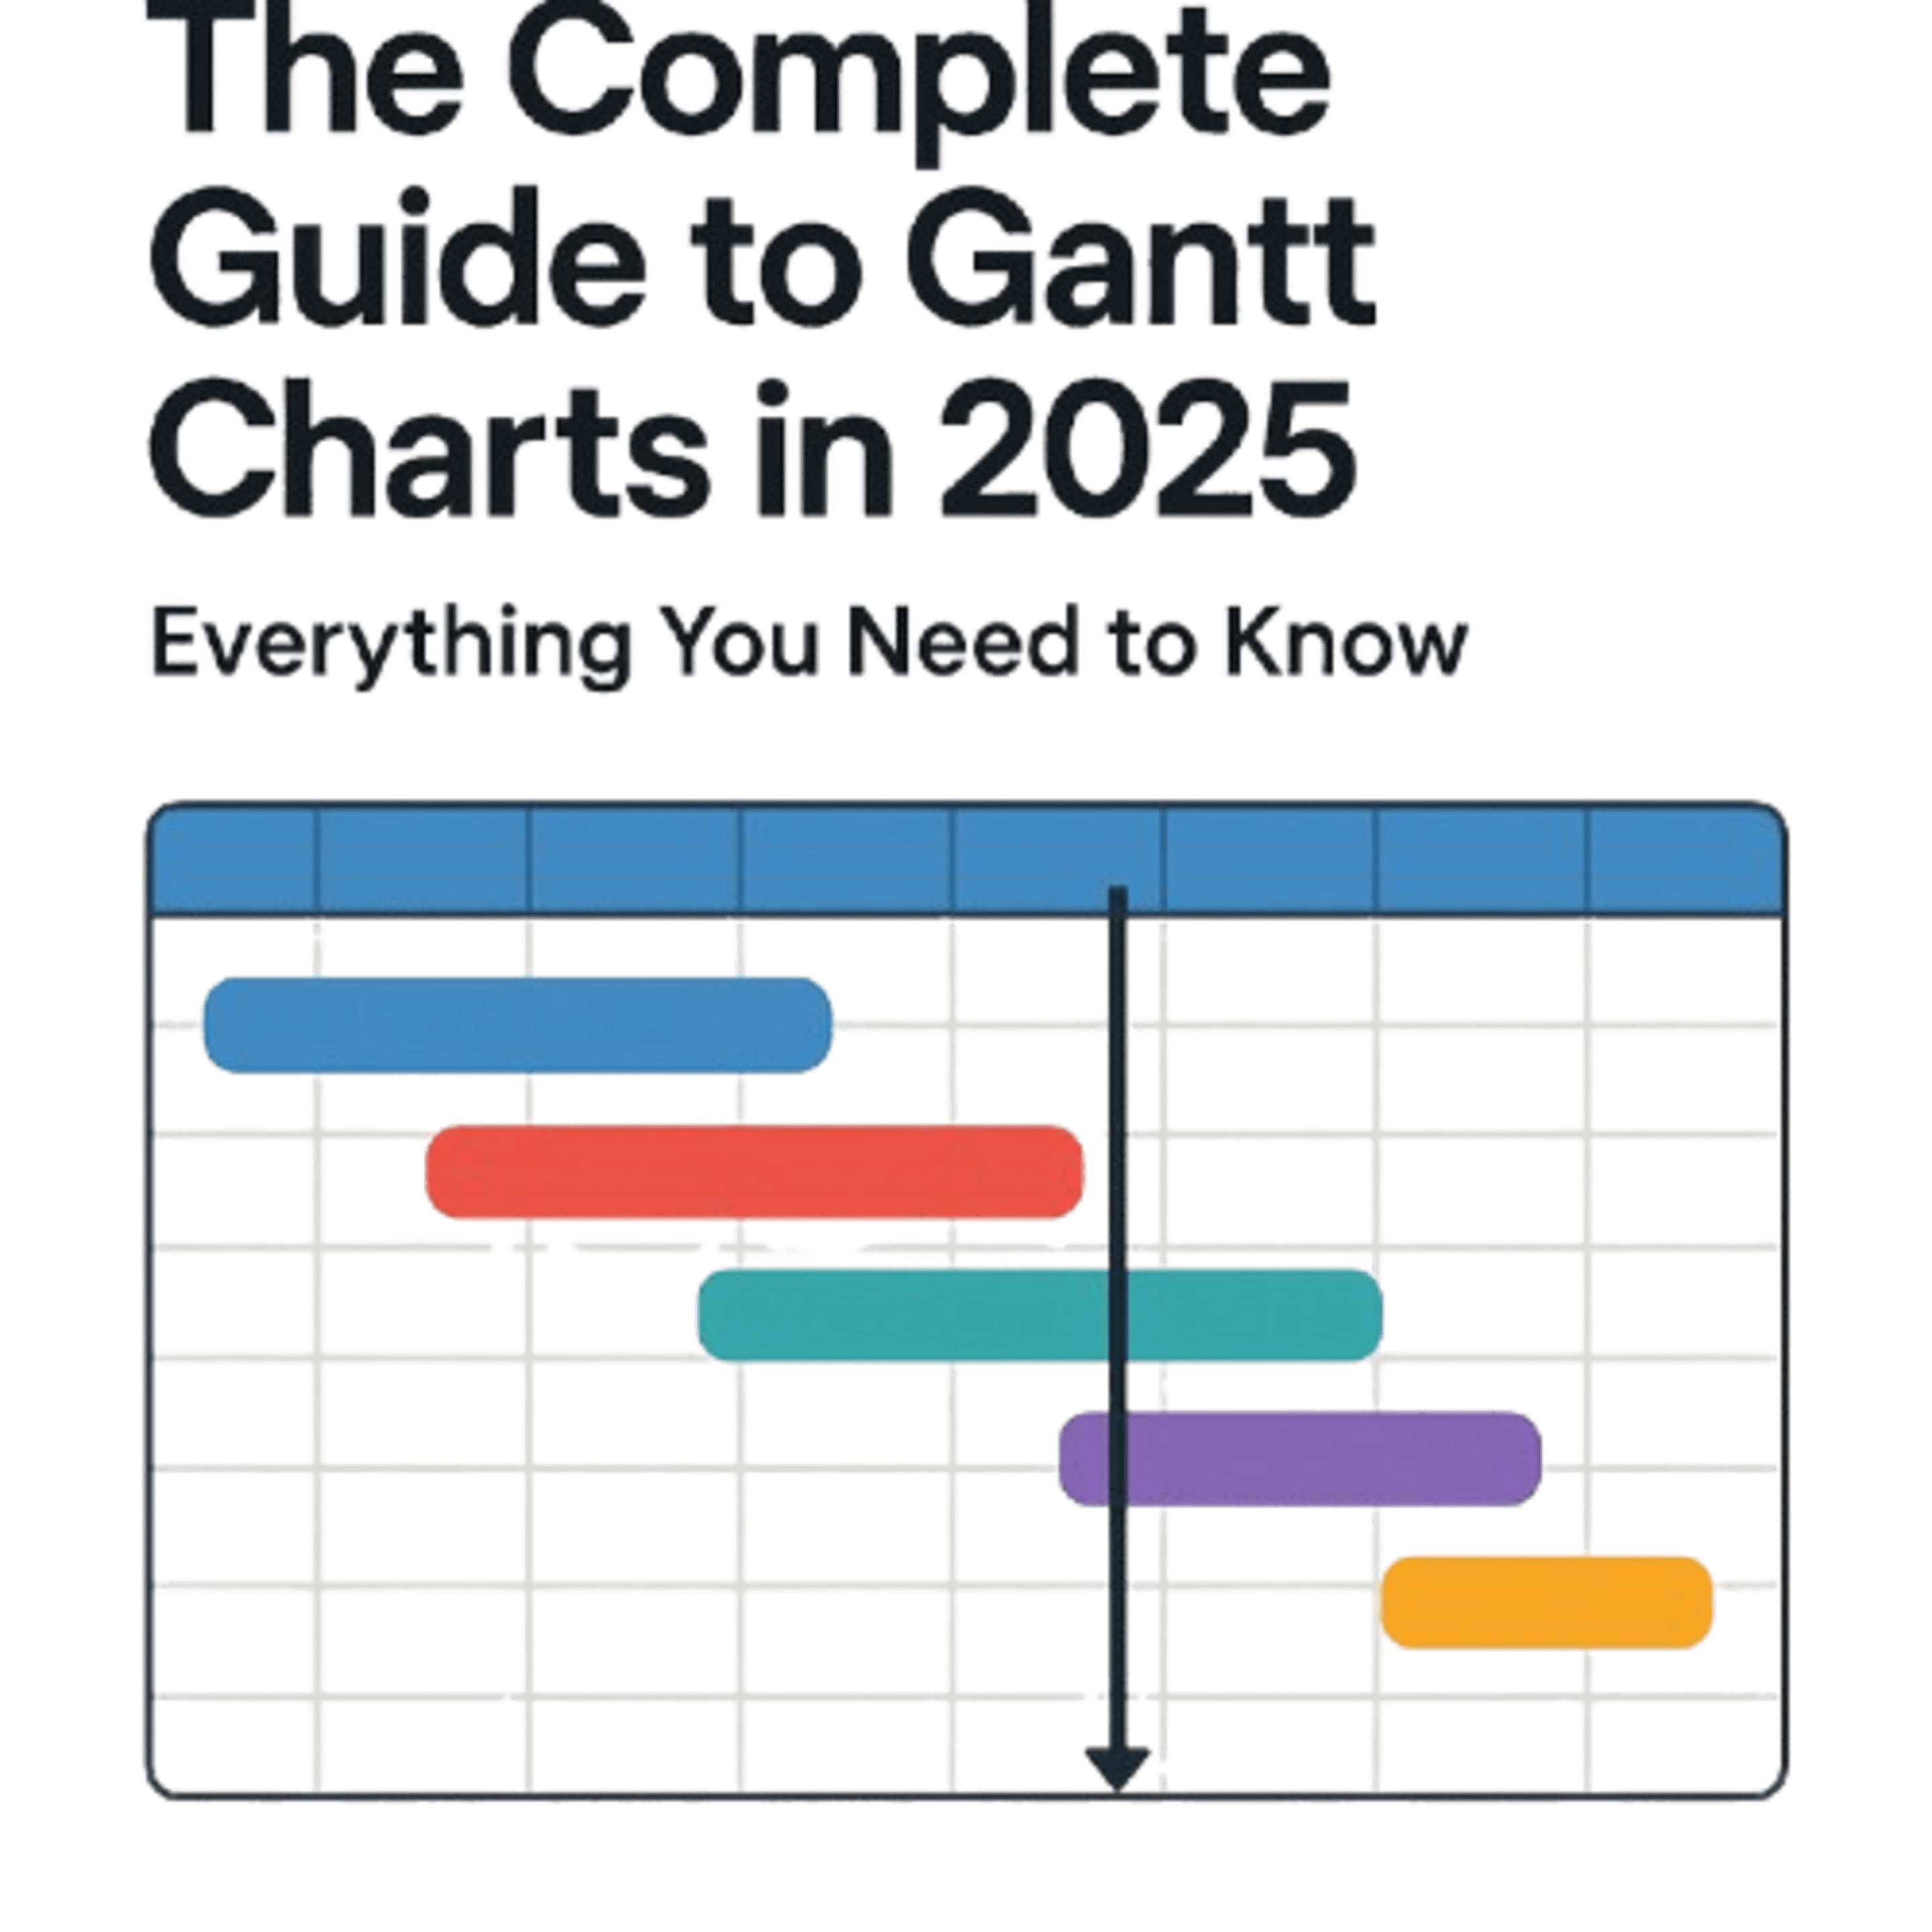
A Gantt chart is a horizontal bar chart that displays project tasks, their durations, and dependencies over time. Named after Henry Gantt who popularized the format in the early 1900s, these charts provide a visual roadmap of your entire project timeline.
| Element | Purpose | Example |
|---|---|---|
| Tasks | Individual work items | "Design wireframes" |
| Duration | Time required | 5 days |
| Dependencies | Task relationships | Task B starts after Task A |
| Milestones | Key checkpoints | "MVP Launch" |
Why Gantt Charts Matter in 2025
The project management landscape has evolved dramatically. Remote teams, agile methodologies, and compressed timelines demand crystal-clear communication and real-time visibility. Here's why Gantt charts remain indispensable:
Visual Clarity
Complex projects become instantly understandable. Team members can see:
- What needs to be done
- When it needs to be completed
- How tasks interconnect
- Where potential bottlenecks exist
Improved Communication
A picture truly is worth a thousand words. Instead of lengthy status emails, share a Gantt chart that shows:
- Current progress at a glance
- Upcoming deadlines
- Resource allocation
- Critical path dependencies
Better Resource Management
Visualizing workloads helps prevent:
- Team member overallocation
- Resource conflicts
- Unrealistic deadline commitments
Core Components of Effective Gantt Charts
Let's break down the essential elements that make Gantt charts powerful:
Task Breakdown Structure
Start with your project's major deliverables, then break them into smaller, manageable tasks. Each task should be:- Specific and actionable
- Assigned to a clear owner
- Estimated with realistic timeframes
Dependencies and Relationships
Map how tasks connect to each other:- Finish-to-Start: Task B begins when Task A completes
- Start-to-Start: Tasks begin simultaneously
- Finish-to-Finish: Tasks must end together
Critical Path Identification
The sequence of tasks that determines your project's minimum duration. Delays in critical path tasks directly impact your final deadline.
Common Gantt Chart Mistakes (And How to Avoid Them)
Even experienced project managers fall into these traps:
Common Mistake
Mistake 1:
Over-detailed task breakdown that creates chart clutter
Solution:
Focus on tasks that take 1-2 days minimum. Anything shorter should be grouped or treated as a subtask. Your Gantt chart should show the forest, not every individual tree.
Common Mistake
Mistake 2:
Ignoring buffer time for unexpected delays
Solution:
Build in 15-20% buffer time for critical tasks. This isn't pessimism - it's realistic planning that accounts for the inevitable unknowns.
Common Mistake
Mistake 3:
Creating static charts that quickly become outdated
Solution:
Update your Gantt chart weekly at minimum. Modern tools make this easy with real-time collaboration and automatic progress tracking.
Best Practices for 2025
1. Start Simple, Evolve Gradually
Begin with major milestones and key deliverables. Add detail as your project planning matures:
Phase 1: High-level milestones (5-10 items)
Phase 2: Major deliverables (15-25 items)
Phase 3: Detailed task breakdown (50+ items)
2. Color-Code Strategically
Use consistent color schemes across projects:
- Blue: Planning and research tasks
- Green: Development and creation work
- Orange: Review and approval processes
- Red: Critical path and high-priority items
3. Integrate with Modern Workflows
Your Gantt chart shouldn't exist in isolation. Connect it with:
- Team communication tools (Slack, Microsoft Teams)
- File sharing platforms (Google Drive, Dropbox)
- Time tracking systems (Toggl, Harvest)
- Agile boards (Jira, Trello)
Advanced Techniques for Power Users
Resource Leveling
Balance workloads by visualizing team capacity:
| Team Member | Mon | Tue | Wed | Thu | Fri |
|---|---|---|---|---|---|
| Sarah (Designer) | 6h | 8h | 4h | 8h | 6h |
| Mike (Developer) | 8h | 8h | 8h | 2h | 8h |
| Lisa (PM) | 4h | 6h | 6h | 8h | 4h |
Baseline Tracking
Save your original timeline as a baseline. Compare actual progress against initial estimates to improve future planning accuracy.
Milestone Dependencies
Create milestone-to-milestone dependencies for high-level project coordination, especially useful for:
- Multi-team projects
- Client approval gates
- External vendor deliverables
When NOT to Use Gantt Charts
Gantt charts aren't always the right solution:
- Highly iterative projects: Kanban boards work better for continuous workflow
- Simple, single-person tasks: A basic to-do list is more efficient
- Exploratory research projects: Timelines are too uncertain for fixed scheduling
Getting Started: Your First Gantt Chart
Ready to create your first Gantt chart? Follow this step-by-step approach:
List All Project Tasks
Brainstorm everything that needs to be done. Don't worry about order or timing yet.Estimate Task Durations
Be realistic. Consider team experience, complexity, and potential obstacles.Identify Dependencies
Which tasks must be completed before others can begin? Map these relationships.Assign Resources
Match tasks to team members based on skills, availability, and workload.Set Milestones
Mark key deliverables, client reviews, and project phases.
The Future of Gantt Charts
As we move through 2025, Gantt charts continue evolving with technology:
- AI-powered scheduling that suggests optimal task sequences
- Real-time collaboration with instant updates across distributed teams
- Mobile-first design for on-the-go project management
- Integration APIs connecting with hundreds of business tools
Key Takeaways
Gantt charts remain one of the most powerful tools in a project manager's arsenal. When used correctly, they provide:
- Clear visual communication of project timelines
- Better resource allocation and workload management
- Early identification of potential scheduling conflicts
- Improved stakeholder confidence through transparent planning
The key is finding the right balance: detailed enough to be useful, simple enough to stay maintainable.
Ready to transform your project management approach? Start with a simple Gantt chart for your next project. Focus on the big picture first, then add detail as needed. Your team - and your deadlines - will thank you.
What's your biggest challenge with project timeline management? Have you found Gantt charts helpful in your work? Share your experiences and questions in the comments below.